Portfolio management for funds, sponsors, and family offices
Roll up properties, leases, loans, and investor positions into a single source of truth — with the entity hierarchy and reporting your LPs expect.
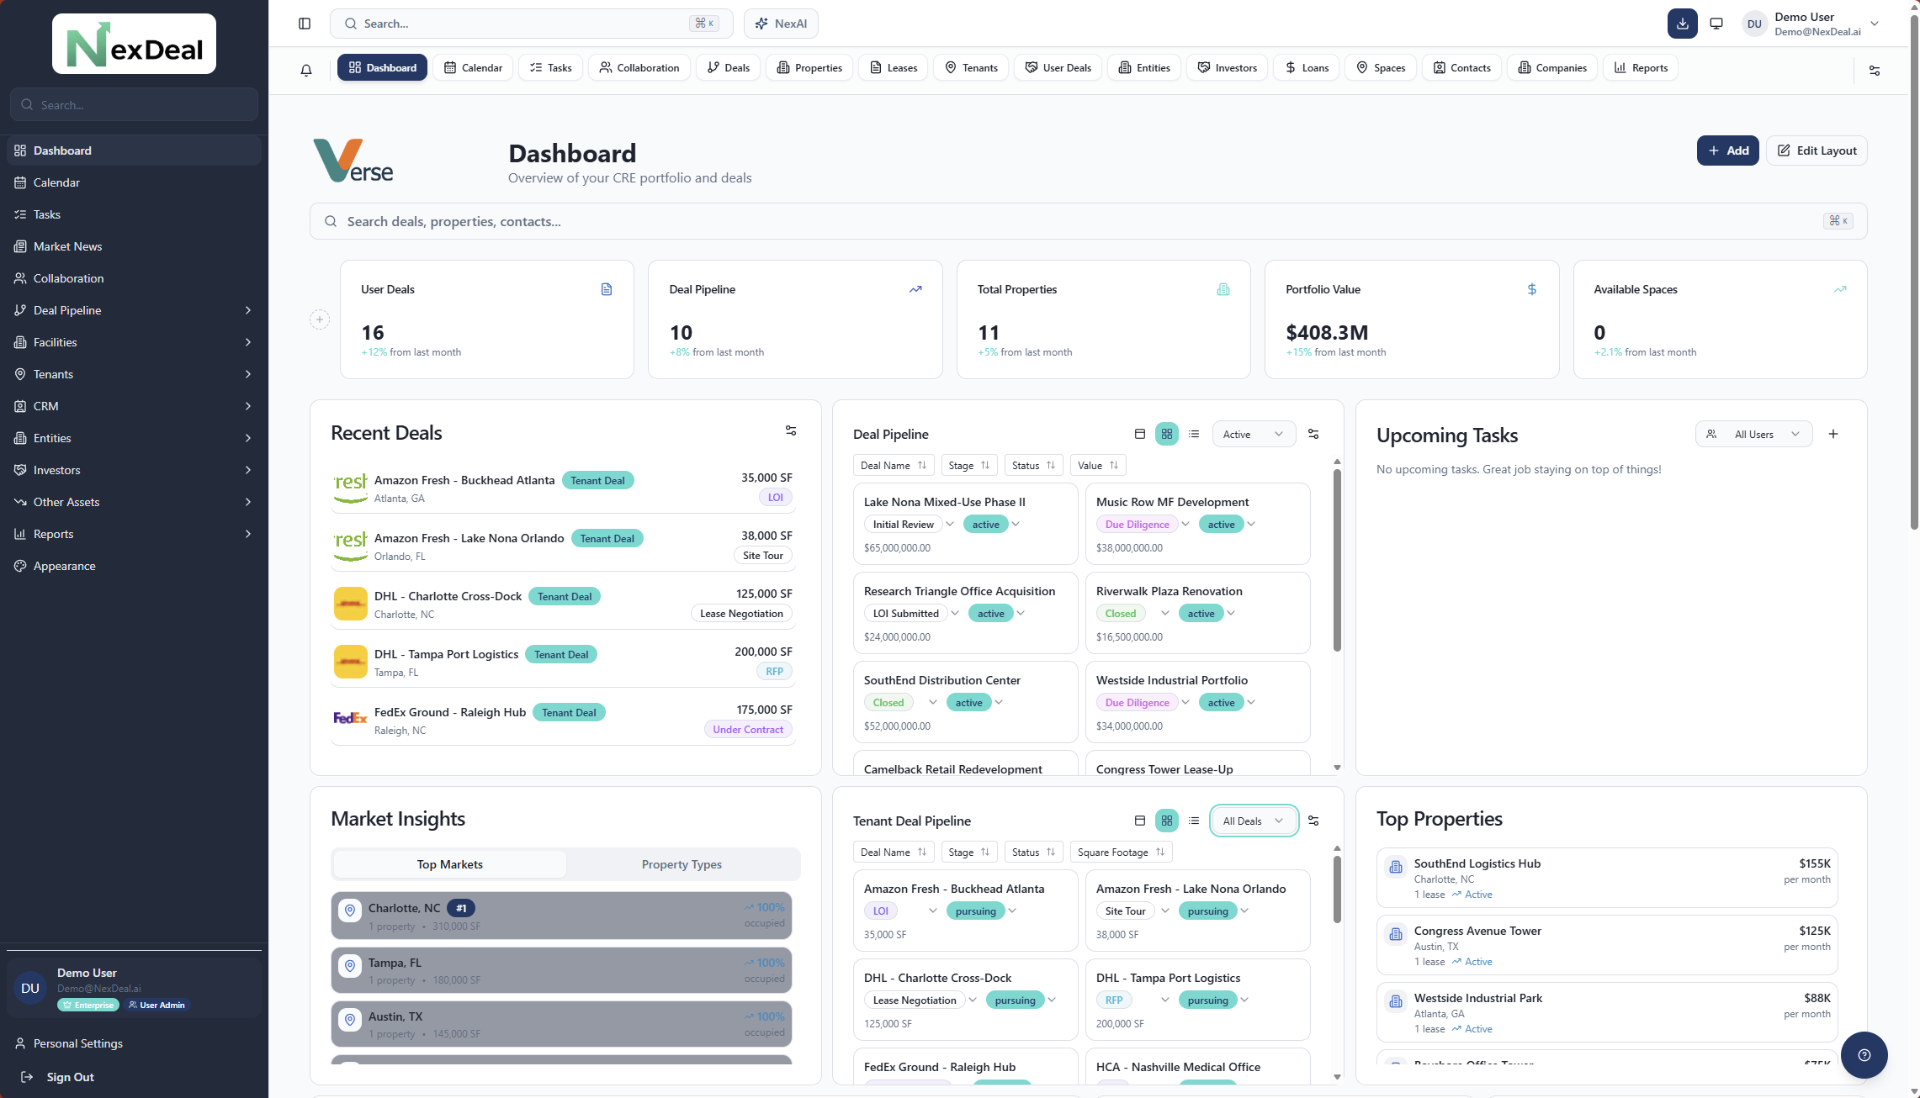
- Funds, Asset Groups, and entity-level hierarchy
- AI-generated portfolio summaries and performance insights
- Drag-and-drop dashboards with resizable widgets
- Export to Excel, PDF, or DOCX with custom branding
From asset to fund — connected
Entity hierarchy
Funds and Portfolios at the top, Asset Groups as project source-of-truth, transactional entities below — all linked.
Asset Groups
Group multi-building properties or development sites into a single project workspace with shared docs, contacts, and metrics.
Live dashboards
12-column drag-and-drop grid with role-based templates for executives, asset managers, and analysts.
Reports & exports
Build custom reports with branded templates. Export to Excel, PDF, or DOCX in one click.
Investor & capital tracking
Capital calls, distributions, and waterfalls roll up automatically to fund-level views.
Cross-account sync
NexBridge syncs records between affiliated accounts — perfect for JV partners and parent/sub structures.
Frequently Asked Questions
How does the entity hierarchy work?
The platform separates strategy (Funds/Portfolios), project source-of-truth (Asset Groups), and operational entities (LLCs, transactional vehicles). Each level rolls up automatically.
Can I customize dashboards per role?
Yes. Dashboards use a 12-column grid with drag-and-drop widgets, plus 18 prebuilt single-tab and multi-tab templates for executives, asset managers, and analysts.
Does it work for tenant rep or only landlords?
Both. The Tenant Rep / Occupier module has its own deal flow, but tenant portfolios (locations, leases) roll into the same dashboards as landlord portfolios.
Ready to see Portfolio Management in action?
Start a free trial — no credit card required. Founding Member pricing locks in $299/mo for life.